📊 KPI Dashboard
Definition
The KPI Dashboard provides key performance indicators to measure both product delivery efficiency and technical reliability.
It helps teams monitor performance, identify bottlenecks, and drive continuous improvement across product and engineering.
ℹ️ Industry-standard DORA metrics are not available yet — they are planned on the roadmap. The dashboard currently tracks the metrics listed below.
Dashboard
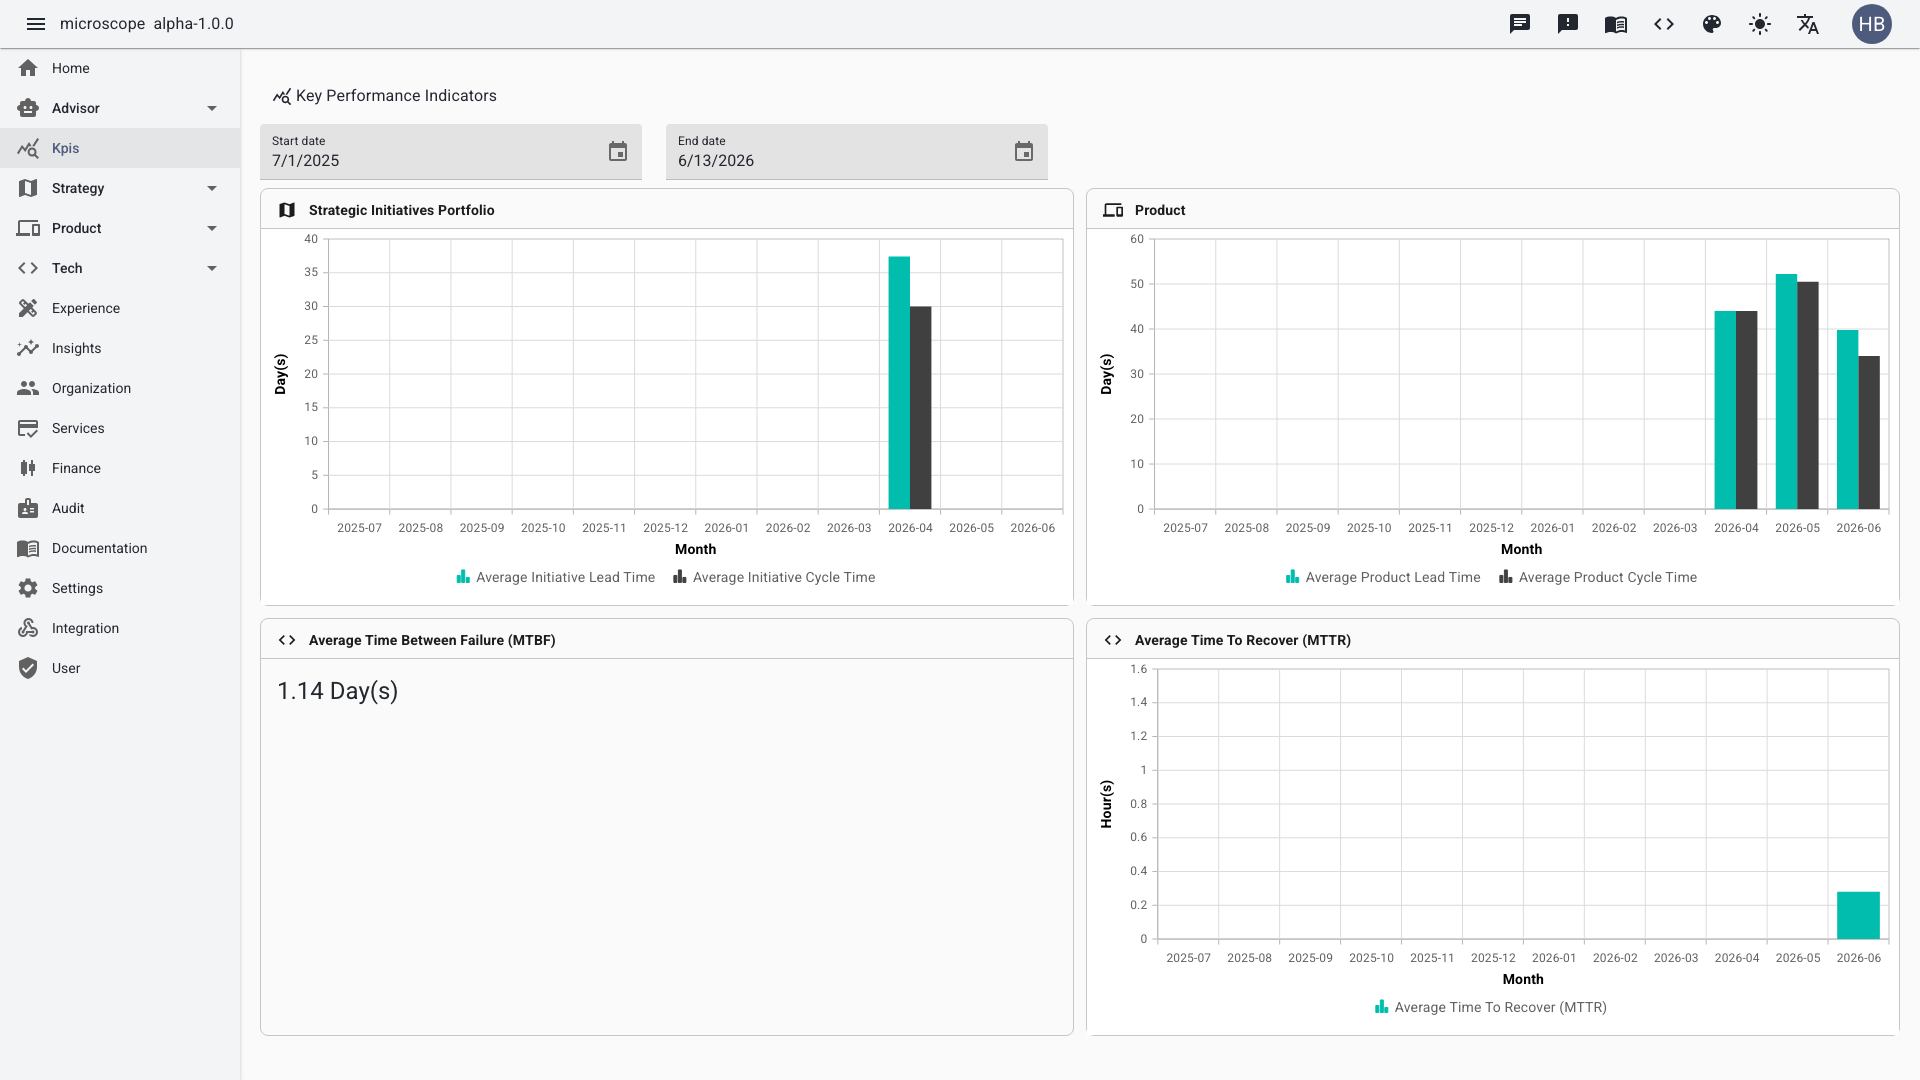
The dashboard consolidates the available metrics with date-range filtering and trend visualization, so you can read execution, delivery, and reliability at a glance.
Available metrics
Lead time measures the full duration from creation to delivery, while cycle time measures only the active work, from when it actually starts to completion.
🚀 Execution performance
How fast strategic execution flows.
- Initiative lead time — time from a strategic initiative's creation to its delivery
- Initiative cycle time — time from when work on the initiative actually starts to its completion
📦 Delivery performance
How fast product requirements are delivered.
- PRD lead time — time from a PRD's creation to its delivery
- PRD cycle time — time from when work on the PRD actually starts to its completion
⚙️ Systems performance
Operational reliability of services.
- MTTR (Mean Time To Recovery) — average time to restore service after an incident; indicates incident response efficiency
🛡 Reliability
- MTBF (Mean Time Between Failures) — average time between system failures; indicates system reliability and stability
📈 Unified Monitoring
- Combine execution, delivery, and systems metrics in a single view
- Correlate delivery performance with system reliability
- Support data-driven decision making across teams