🧭 Journeys
Definition
A Journey maps how a user actually experiences your products and services: it is the ordered sequence of steps a persona goes through, with their feeling, pain points, and improvement opportunities at each step.
The goal: connect the lived experience to the personae and the technical workloads that deliver it, so you can decide where to invest.
How to define it properly
- Start by describing your personae: who the journey is for
- Break the journey into clear, ordered steps (from discovery to usage)
- For each step, qualify the feeling with an experience impact score
- Link each step to the relevant persona and the workload that supports it
- Document pain points (with their severity) and opportunities
- Fill in the journey health scores: CSAT, NPS, CES
Listing journeys
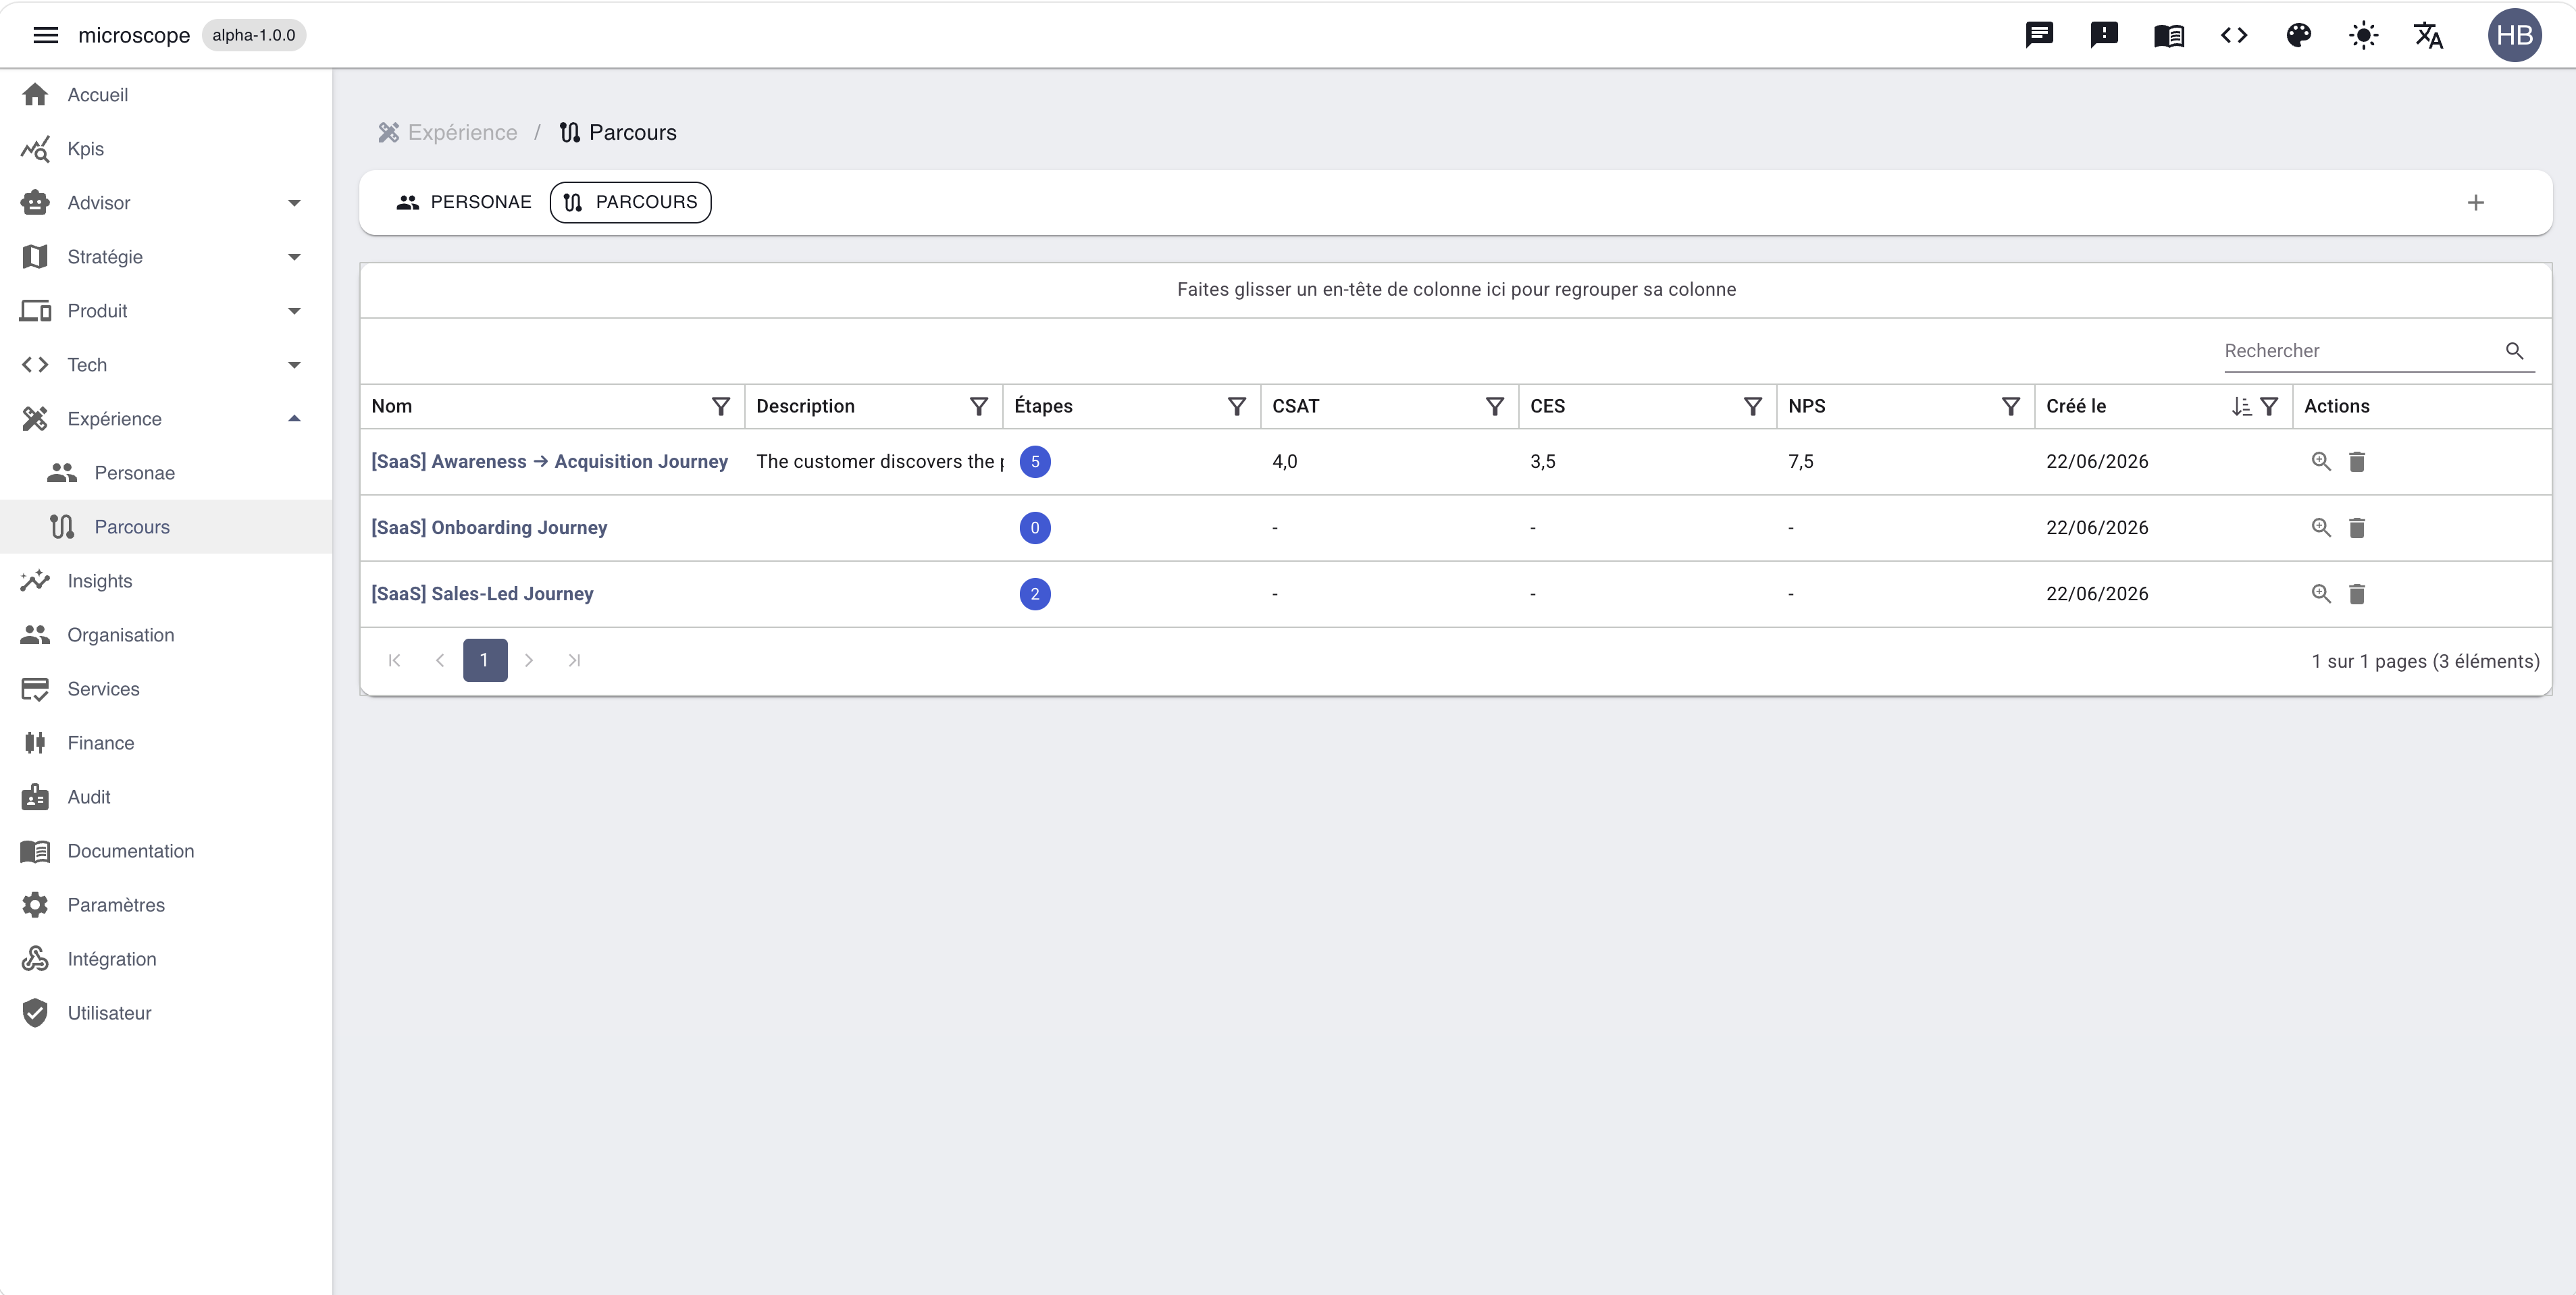
The list view shows all journeys with their step count and health scores (CSAT, CES, NPS). Filter, sort, and search to find a journey. Use the Add button to create a journey, then open it to build it out.
Journey detail
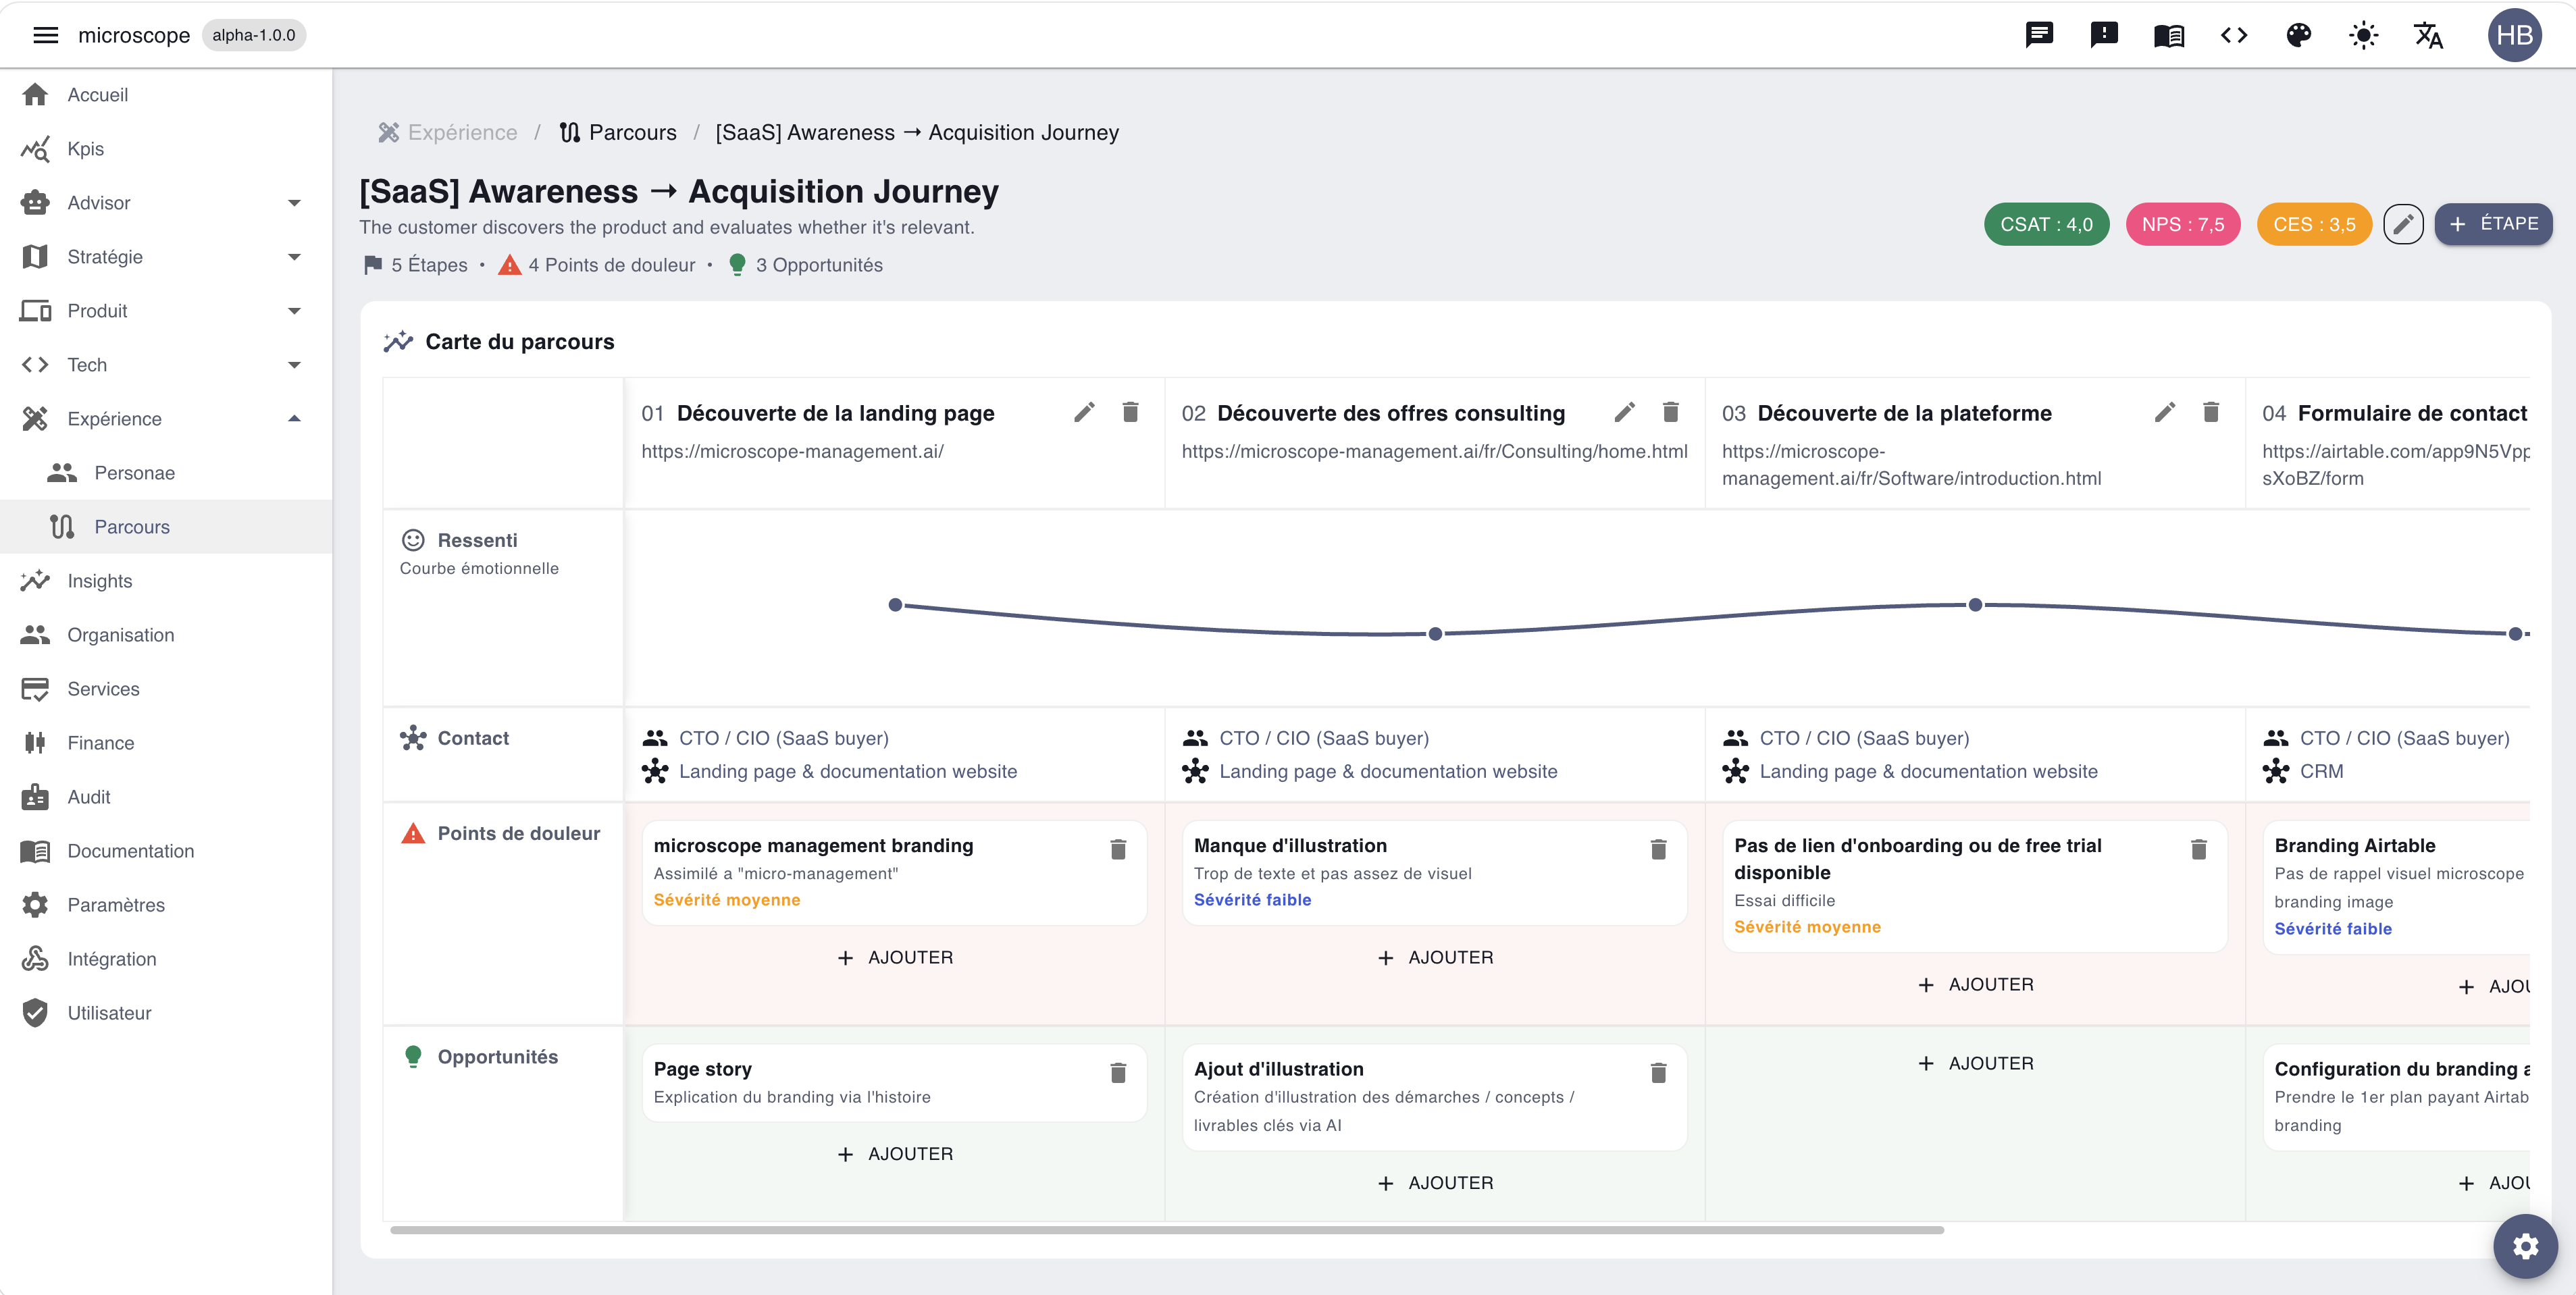
The journey detail page presents the journey map: a grid where each column is a step and each row a dimension of the experience. The header recalls the journey title, the step count, the total number of pain points and opportunities, and the CSAT, NPS, and CES scores.
Steps
Each step is an ordered column of the journey (numbered 01, 02, …). It carries a title, a description, and its experience impact score. Use the Step button to add one, or the edit/delete actions on each column.
The emotional curve
The Feeling row traces the journey's emotional curve: the impact score of each step is plotted on a chart, from very negative to very positive. It reveals at a glance the high points and the friction points across the whole experience.
Contact: persona & workload
The Contact row shows, for each step, the persona who lives it and the workload that delivers it. These links are set in the step edit form: they connect the experience to user profiles and to the technical estate. The workload links back to its entry in the Tech module.
Pain points
The Pain points row lists, for each step, the frictions encountered. Each pain point has a label, a description, a severity (Low, Medium, High), and a frequency. Click a card to edit it, or Add to create one.
Opportunities
The Opportunities row captures, for each step, the improvement ideas identified. Each opportunity has a label and a description. It is the positive counterpart of pain points: what could make the experience better.
CSAT, NPS & CES
Three health indicators qualify the journey as a whole:
- CSAT (Customer Satisfaction Score) — overall perceived satisfaction
- NPS (Net Promoter Score) — propensity to recommend
- CES (Customer Effort Score) — perceived effort to reach the goal
They are set through the journey edit form and displayed both in the detail header and in the journeys list, so you can track a journey's health over time.
Experience impact score
Each step carries an impact score that captures the feeling at that moment of the journey, on a scale from very negative to very positive:
- 😡 Very negative — strong friction moment
- 🙁 Negative — experience below expectations
- 😐 Neutral — nothing remarkable
- 🙂 Positive — satisfying experience
- 😄 Very positive — standout, differentiating moment
These scores feed the emotional curve and help prioritize the steps to rework.